RACIAL DIFFERENCES IN A1C EXIST BUT DIFFERENCES WITHIN RACES MORE PROFOUND
Drs. Rich Bergenstal and Roy Beck presented (on behalf of the Jaeb Center) compelling results confirming that racial differences exist in the relationship between mean glucose and HbA1c – yet, they ultimately concluded that difference were small in the context of even greater variation in the mean glucose-A1c relationship within races.
From www CloseConcerns Knowledgebase
Nyhetsinfo
www red DiabetologNytt
The multi-center observational study (n=208) recruited 104 non-Hispanic African American and 104 non-Hispanic white participants to wear the blinded FreeStyle Libre Pro for 12 weeks. Topline results were consistent with the prevailing hypothesis – data showed a 0.8% increase in mean A1c between African Americans and Whites that reflected only a 10 mg/dl difference in mean glucose. The glycemic difference was very clear though Dr. Bergenstal broke this elevated A1c into two possible components: (i) non-glycemic factors [e.g., genetics, biology]; and (ii) glycemic factors [e.g., access to care, technology, social determinants of health]. Importantly, he stressed that the study group has now shown a specific impact of the first component, thereby confirming that biological racial difference in the A1c-mean glucose relationship exist. Specifically, results showed that African Americans had an average 0.3% increase in A1c for a given mean glucose level. Dr. Bergenstal termed this a “small but real” overestimation.
-
Dr. Bergenstal shared that African Americans’ increased rate of glycation is “unlikely to be clinically meaningful.” He cited that the 0.3% A1c increase represents less than half of the overall A1c difference (0.8%) between the two cohorts and – more importantly – that there is considerable variation in mean-glucose A1c relationship irrespective of race.
- He shared findings that mean glucose could range 80 mg/dl for a given A1c – e.g., an estimated A1c of 8.0% could correspond to a mean glucose of 120 mg/dl or 200 mg/dl for either cohort – suggesting that looking at A1c alone could be dangerously misleading. [We’ve seen similar data from Dr. Irl Hirsch before.] With this in mind, the results ultimately appear to tell more about variation in A1c with average glucose than race. Indeed, as Dr. Bergenstal noted, the implication is that while A1c is an established measure of risk of developing complications, we would be wise to personalize diabetes and treatment decisions based on glucose values. This is not groundbreaking by any means – we’ve long known that A1c in isolation simply is not the best metric. However, Dr. Bergenstal’s words seem to go further, stressing that A1c is not simply inadequate but can be dangerously misleading and clinically ignorant (e.g., treating a patient with mean glucose of 120 mg/dl and 200 mg/dl the same because the A1c reads 8.0%).
- Dr. Beck added valuable commentary to this discussion, emphasizing that A1c does remain a very valuable endpoint in clinical trials as a metric for hyperglycemia reduction. He argued that A1c is a “fabulous” and reliable outcome when groups are randomized to eliminate difference but that for individual patients, looking at glucose is critical.
-
Drs. Irl Hirsch and Stephanie Amiel added their VERY valuable perspective during a fascinating Q&A, arguing: (i) for the importance of moving to glucose as a primary metric rather than A1c; and (ii) for the need to establish a relationship between blood glucose and long-term risk of developing complications. We bring you their thoughts below:
- "Historically, we started using A1c because we didn’t have access to glucose. Over time, we learned all these limitations to A1c and all these other biomarkers. In my practice, we don’t know about the difference between Asian Americans and Hispanics, but in the big scheme of things, there is SO MUCH variability between what any one A1c means in terms of glucose. The bigger concerns I have in term of clinical medicine is that very few people do fingerstick glucose testing until they go on insulin. We’re making decisions about whether or not a patient should go on a certainly therapy based on a number that could be 80 or 90 mg/dl off. The paradigm by which we treat type 2 diabetes is wrong, and we’ve been doing it wrong for the past 30 years. As we read about hypoglycemia in elderly, it’s not A1c I’m interested in. It’s the glucose. Simply put, I believe we need to use more fingerstick testing in type 2 diabetes.” – Dr. Hirsch
- "The epidemiological data suggests that the A1c threshold for complications is not different between races, but we need to look at this for glucose. What are we going to do with the patient who has A1c of 8.0% but a mean glucose of 110 mg/dl? They are NOT going to have same risk as a patient with an A1c of 8.0% and a mean glucose 200 mg/dl. But on the other hand, as far as I know, we simply don’t know that that’s not true. We need data.” – Dr. Amiel
VICTORY FOR DATA STANDARDIZATION: ROCHE, ABBOTT, DIASEND, GLOOKO SAY YES TO AGP
In a victory for data standardization, we learned that the International Diabetes Center has signed two agreements in the past week to license its one-page, standardized Ambulatory Glucose Profile (AGP) to two diabetes device makers (Roche and Abbott) and two diabetes data management companies (Diasend and Glooko).
This was good news to hear – we’re eager to see greater standardization of data and use of that data to drive therapeutic change. The partnerships give the companies the right to use the AGP in all their diabetes devices and existing software; the agreement with Abbott extends the groups’ existing partnership to other devices since Abbott already uses the AGP report to visualize downloaded FreeStyle Libre glucose data.
Clinicians have for a long time told us how much they like this standardized report and it’s fantastic to see that companies are beginning to sign on, especially after hearing for years the laundry list of reasons why industry was hesitant: (i) a desire to maintain control of data due to liability concerns; (ii) a desire to protect against competition by building their own proprietary software; (ii) a desire to preserve their direct relationship with patients; and (iv) the antiquated view that patients do not need access to their data (though we’d note that this is almost gone now.) Indeed, on all these levels, the willingness of Abbott, Roche, Diasend, and Glooko to license the report is a real win for patients and providers alike – after all, not every company is going to get what they want with a standardized report, but the field will benefit significantly from consensus.
We’re hopeful this creates momentum and these partnerships set the stage for this standardization movement to reach a critical mass – will Dexcom and Medtronic sign on? Along these lines, we learned that AGP partnerships with three additional device companies and aggregators are slated for “the next month,” and we’ll be watching closely for updates on the IDC team’s recently launched website: AGPreport.org.
NOTABLE POSTERS ON OPENAPS; MEDTRONIC ENLITE 3, HARMONY 1; SENSEONICS; AND ONETOUCH VIA
- Medtronic presented accuracy data from a pivotal study of its fourth-generation sensor (Enlite 3), to be used with the MiniMed 670G or the Guardian Connect mobile app. The new sensor demonstrated an overall MARD of ~10.5% vs. YSI values measured on days one, three, and seven at 12-hour in-clinic visits (an impressive 23,709 total paired CGM-YSI points). MARD was ~13% on day 1, ~9% on day 3, and ~10% on day 7, with an equal balance of data points collected on each day. Eight-nine participants took part in the study, each wearing two sensors on the abdomen. More details below.
- Another Medtronic poster shared a larger data set on its fifth-generation sensor (i.e., Harmony 1), featuring one calibration per day, 10-day wear, and an overall MARD of 11.4% vs. the Bayer Contour Next Link meter (n=142 sensors, 12,602 evaluation points). See all the data below.
- An illuminating poster presented fascinating data from 18 out of the first 40 users of OpenAPS, the DIY automated insulin delivery system created by Ben West, Dana Lewis, and Scott Leibrand (now over 150,000 hours of AID use outside any clinical trial setting!). While using OpenAPS, self-reported outcome measures showed median A1c dropped from 7.1% to 6.2%, an impressive 0.9% reduction in a well-controlled and motivated population. Self-reported median percent time-in-range (80-180 mg/dl) increased from 58% to 81% - consistent with presentations of actual data we’ve seen recently from Mark Wilson (Day #1) and Chris Hanneman (D-Data last fall). Fourteen out of 15 respondents reported some improvement in sleep quality, and 56% reported a large improvement. Respondents were “extremely satisfied with the “life changing” improvements associated with using an APS,” even if they “require significant effort to build and maintain” and “cannot be considered a technological cure.” More perspective below, plus a picture of the setup!
- A Senseonics poster shared full accuracy data from the 180-day EU pivotal study of its Eversense implantable CGM system, showing an encouraging MARD of 11.6% vs. YSI, though only 40% of sensors lasted to 180 days.
- The single-arm, multicenter investigation enrolled 71 patients with type 1 diabetes, who had two sensors inserted bilaterally into their upper arm (Clinical Trials Identifier: NCT02154126).
- Six-month accuracy was encouraging with Clarke Error Grid analysis showing 84% of measurements in Zone A and 15% in Zone B (# of paired points unreported). Pre-specified secondary endpoints showed accuracy was diminished in the hypoglycemic range (MARD = 22% <70 mg/dl). The median sensor life was just shy of five months at 149 days.
- See below for positive user experience data on J&J’s OneTouch Via (formerly Calibra Finesse), showing it is easy to use and very easy to train. Great patient and provider feedback in an early ease of use study.
JDRF/NIH CLOSED LOOP MEETING: DESIGNING AP PIVOTAL STUDIES, STANDARDIZING OUTCOMES METRICS
Two major artificial pancreas papers will soon be published in Diabetes Care: Artificial Pancreas Pivotal Study Design Considerations and A Consensus Report on Outcome Measures for Artificial Pancreas Clinical Trials. The former is authored by Drs. Steven Russell and Roy Beck, while the latter includes 24 luminaries in the field. Wow! We include a snapshot of both papers below, which we heard at the JDRF/NIH Closed-Loop Research Meeting. We found Dr. Russell’s overview of design considerations particularly valuable. Stanford’s Dr. Korey Hood also revealed that by fall 2016, a full set of validated questionnaires will be available to assess the psychosocial impact of AID. Yes! That is fantastic news. Enormous thanks to the Helmsley Charitable Trust and JDRF for funding this major project. We’ll be back in our full report with more from this as-always outstanding evening event; see the highlights below.
Big Picture Highlights
1. ADA PRESIDENT DES SCHATZ ON DIABETES AT 212 DEGREES
In a moving and most compelling presidential address, ADA President Dr. Desmond Schatz (University of Florida, Gainesville, FL) underscored the need to bring diabetes to 212 degrees – “the boiling point of water where it erupts with urgency” – to transform the “invisible disease” to a highly visible crisis. Dr. Schatz detailed the many ways in which diabetes is invisible, hidden, and ignored: people hide the reality of living with diabetes from their friends and families, healthcare providers are largely absent in the daily management of the disease, and patients with type 2 diabetes often choose to be invisible due to stigma and feelings of failure. Specifically, he discussed how diabetes remains invisible in the healthcare community, where missed and delayed type 1 and type 2 diabetes diagnoses can lead to DKA and even premature death. In fact, according to Dr. Schatz, almost 20% of children with type 1 diabetes present with DKA, despite the fact that many visit a clinic during the week prior to their diagnosis. We loved the video of an adolescent Katie who described the “real world” of being a person with diabetes, including how she often felt guilty even talking about her diabetes because she didn’t want her family to feel worried. (Nods from through the room from those with diabetes ensued.) In addition, Dr. Schatz emphasized that although diabetes is far more prevalent, NIH funding for the disease pales in comparison to that for HIV/AIDS and cancer – an incredible $35 per patient for diabetes vs. $2,500 for HIV/AIDS and $372 for cancer, another byproduct of its invisibility. To that end, he advocated for taking a page out of the book of successful movements such as those for HIV/AIDS and even the recent Zika epidemic (which recently received a $1.1 billion compromise bill), where people have rallied around a strategic vision and inspired a “fiery sense of urgency”. Throughout the talk, the hashtag #nomoreworry emerged. He concluded his presentation with a powerful call to action: “When all is said and done, the people responsible for real action, who are capable of turning the tide of this epidemic and finding a cure … are likely sitting right next to you in this room!”
Honorable Mentions
AWARD-9 RESULTS SHOW GREATER A1C REDUCTIONS WITH TRULICITY VS. PLACEBO
In front of a standing-room-only crowd, Dr. Paolo Pozzilli (University Campus Bio-Medico, Rome, Italy) presented the results of AWARD-9, a double-blind, 28-week superiority trial comparing the effects of dulaglutide (Lilly’s Trulicity) vs. placebo on A1c and weight when added to insulin glargine in patients with type 2 diabetes. The trial randomized 300 patients with inadequate glycemic control (A1c 7-10.5%) to dulaglutide 1.5mg (n=150) or placebo (n=150) on top of once-daily glargine titrated to a FPG target of 71-99 mg/dl (± metformin). Baseline characteristics were similar between both groups (please see below). Data at 28 weeks showed that compared to placebo, dulaglutide provided significantly greater reductions in A1c (0.67 vs. 1.44, respectively), and in fasting serum glucose (28 vs. 45 mg/dl, respectively; p<0.001 for both comparisons). No difference in the rate of hypoglycemia was observed. Patients on dulaglutide experienced a weight loss (4.2 lbs [1.91 kg]), compared to a weight gain with placebo (1.1 lbs [0.50 kg]; p<0.001). In addition, insulin glargine requirements were statistically significantly lower in the dulaglutide group (13U) versus the placebo group (26U).
POSITIVE WEIGHT LOSS RESULTS FOR INVOKANA + PHENTERMINE
In a late-breaking poster, in some of the first major obesity news of the meeting, phase 2 results of the co-administration of J&J’s Invokana (canagliflozin) and phentermine showed significantly greater weight loss vs. placebo in adults with overweight and obesity. This study was a four-arm, 26-week study and evaluated the efficacy and safety of Invokana + phentermine, phentermine alone, Invokana alone, and placebo in 334 adults with BMIs of 30-50 kg/m2 and without type 2 diabetes or with hypertension and/or dyslipidemia and BMIs of 27-50 kg/m2. The findings demonstrated that at 26 weeks, from a mean baseline BMI of ~37 kg/m2, the Invokana + phentermine group achieved significantly greater weight loss (7.5%) compared to the other groups (4.1%, 1.9%, and 0.6% for Invokana, phentermine, and placebo, respectively). In addition, the combination therapy group had a significantly higher proportion of participants achieving ≥5% weight loss compared to placebo (67% vs. 18%). Only 18% and 42% of the Invokana and phentermine groups’ participants achieved weight loss of at least 5%. On other secondary endpoints, the combination therapy group also had a significant reduction in systolic blood pressure, with a placebo-subtracted reduction of 4.2 mmHg. Regarding safety and tolerability, no new signals emerged from these data; however, the combination therapy, phentermine, and Invokana groups all experienced increases in heart rate of 3.5 bpm, 4.1 bpm, and 0.7 bpm, respectively – an observation whose potential consequences on cardiovascular events have not yet been determined and will likely warrant further investigation. Ultimately, these findings are powerful in support of using phentermine with SGLT-2 inhibitors in chronic weight management, and we are interested to see whether Janssen will move forward with phase 3 trials, and ultimately pursue an obesity indication. Combination therapies have certainly gained significant attention within obesity management (in addition to diabetes), and we have specifically heard greater enthusiasm for the potential of GLP-1 agonists and SGLT-2 inhibitors in weight management. With so much evidence already accumulated on these various diabetes drugs, we look to see how industry, healthcare providers, and the FDA envision the movement of these products into obesity, given the troubled commercial environment for obesity compounds to date and given the extreme high need for therapy to help patients.
HIGHER MORTALITY FOLLOWING NON-FATAL CV EVENTS IN EXAMINE; NO DIFFERENCE BETWEEN TREATMENT GROUPS
Takeda presented a post-hoc analysis from EXAMINE (as a poster [1090-P] and in a press briefing) demonstrating significantly higher mortality among patients who experienced non-fatal CV events during the trial than those who did not, with no difference between the Nesina (alogliptin) and placebo groups. The overall EXAMINE results (first presented at ESC 2013) demonstrated a comparable effect on CV outcomes with Nesina vs. placebo, both in addition to standard of care. Among all trial participants, the hazard ratio was 0.85 (95% CI: 0.66-1.10) for cardiovascular death and 0.80 (95% CI: 0.57-1.12) for sudden cardiac death. This analysis compared mortality rates in patients who experienced a major non-fatal CV event (MI, hospitalization for unstable angina or heart failure, or stroke) during the trial vs. those who did not. Results demonstrated a significant increase in CV mortality following any non-fatal event, with the most startling effect in patients hospitalized for heart failure. One in 10 of those patients died within three to four months of the hospitalization and approximately one third died within the next 20 months. There was no difference in mortality between the Nesina and placebo groups in patients hospitalized for heart failure (22.7% vs. 34.1% mortality; HR = 1.02; 95% CI: 0.51-2.02) or in the control group of patients who did not experience any CV events (4.5% vs. 5.8% mortality; HR = 0.81; 95% CI: 0.63-1.05). These results underscore the significant morbidity and mortality associated with heart failure in patients with type 2 diabetes and reinforce its importance as an endpoint in CVOTs for diabetes drugs. They also provide some degree of reassurance that Nesina does not worsen heart failure-related outcomes; the FDA recently added a warning to Nesina’s label based on the non-significant imbalance in hospitalization for heart failure in EXAMINE, but there is still no clear consensus in the field on the legitimacy of that finding.
GREATER A1C REDUCTIONS WITH ERTUGLIFLOZIN/SITAGLIPTIN COMBINATION VS. INDIVIDUAL COMPONENTS
Merck/Pfizer presented interim, 26-week results in a poster (125-LB) from an ongoing phase 3 trial demonstrating significantly greater A1c reductions with Merck/Pfizer’s ertugliflozin plus sitagliptin (Merck’s Januvia) versus either drug alone in patients with type 2 diabetes. The study recruited 1,233 patients inadequately controlled (A1c 7.5-11%) on stable metformin (≥8 wks at ≥1,500 mg/day), who were randomized to one of five groups: ertugliflozin 5mg or 15mg daily plus sitagliptin 100mg daily, ertugliflozin 5mg or 15mg daily alone, or sitagliptin 100mg daily alone. Data at 26 weeks showed that co-administration of ertugliflozin with sitagliptin led to significantly greater reductions in A1c (1.5% for both groups) compared to either drug alone (1%-1.1% across the three groups; p<0.002). A similar effect was observed with fasting plasma glucose and percentage of patients achieving A1c <7%. Co-administration also led to significantly greater reductions in body weight and systolic blood pressure compared to sitagliptin alone. Static beta-cell responsivity increased across all treatment arms and no difference was observed with the co-administration groups.
- Merck/Pfizer also presented a poster (130-LB) with interim, 26-week results from the ongoing VERTIS MONO trial demonstrating significantly greater A1c reductions with Merck/Pfizer’s ertugliflozin vs. placebo in patients with type 2 diabetes. The study recruited 461 patients with inadequate glycemic control on diet and exercise (A1c 7-10.5% with no anti-diabetic agents taken within 8 weeks of starting the study), who were randomized to placebo (n=153), ertugliflozin 5mg daily (n=156), or ertugliflozin 15mg daily (n=152). Twenty-six-week data showed that both ertugliflozin doses provided statistically significantly greater A1c reductions vs. placebo (0.99% for the 5mg dose and 1.16% for the 15mg dose); similar results were observed for fasting plasma glucose, body weight, and 2-hour post-prandial glucose. In addition, a greater proportion of patients achieved an A1c <7% in the ertugliflozin groups vs. placebo (28.2% with ertugliflozin 5 mg and 35.8% with ertugliflozin 15 mg vs. 13.1% with placebo).
ADA PARTNERS WITH IBM
In the opening of the presidential address, ADA CEO Mr. Kevin Hagan announced the ADA’s new long-term partnership with IBM Watson Health to improve diabetes prevention and management. IBM Watson General Manager Mr. David Kenny joined Mr. Hagan on stage to briefly discuss the collaboration, a tremendous signal of IBMs investment in this partnership, which will leverage Watson’s computing brainpower and artificial intelligence (AI) capabilities and the ADA’s enormous repository of clinical data to create a sophisticated diabetes advisor to help inform treatment decisions. We’re not entirely sure what specific output could result from this agreement, but clinical decision support and more personalized therapy are under consideration. In addition, the partnership will develop a cloud-based data and insights service to optimize scientific research; new offerings may also leverage Watson’s unique artificial intelligence capabilities, such as natural language processing and predictive analytics. Said Mr. Kenny, “AI can help scale the expertise of professionals in this room… Our goal is to power up your big ideas and create new products that will transform the lives of people with diabetes.” In addition, he announced a Watson-based innovation challenge that pushes developers to propose cognitive apps that will advance the use of technology to improve the lives of people with diabetes or prediabetes. According to the press release issued during the presentation, Watson will also be trained to understand diabetes data to identify potential risk factors and create recommendations for both patient and providers – important steps forward in our pursuit of personalized medicine. This expands on IBM Watson’s diabetes partnerships with Medtronic (building a personal diabetes assistant, SugarWise) and Novo Nordisk (no details shared since last December).
TECH EXHIBIT HALL – BD/MEDTRONIC INFUSION SET TO LAUNCH IN US/FRANCE BY “END OF 2016”
In the tech exhibit hall, we learned that BD/Medtronic’s MiniMed Pro FlowSmart Infusion Set will launch in the US and France “by the end of 2016.” We also have coverage of Ascensia, InSpark Technologies, and Valeritas in addition to all the companies we visited yesterday.
Detailed Discussion and Commentary
Oral Presentations: Treatment Choices after Orals in Type 2 Diabetes
EFFICACY AND SAFETY OF ONCE-WEEKLY SEMAGLUTIDE VS. SITAGLIPTIN AS ADD-ON TO METFORMIN AND/OR THIAZOLIDINEDIONES AFTER 56 WEEKS IN SUBJECTS WITH TYPE 2 DIABETES
Bo Ahrén, MD, PhD (Lund University, Sweden)
In the double-blinded, double-dummy, active-controlled, parallel-group SUSTAIN 2 trial (n=1231), semaglutide 0.5 mg produced a 0.77% greater A1c reduction (p<0.0001) and semaglutide 1.0 mg produced a 1.06% greater A1c reduction (p<0.0001) than Merck’s Januvia (sitagliptin 100 mg) after 56 weeks of treatment. Participants had type 2 diabetes and were on metformin, TZDs, or both. In total, semaglutide 0.5 mg produced a 1.3% A1c reduction and semaglutide 1.0 mg produced a 1.6% A1c reduction, compared to sitagliptin’s 0.5% A1c reduction (baseline A1c=8.1%, p<0.0001). Participants treated with semaglutide 0.5 mg and 1.0 mg experienced a 17.4 mg/dl and 26.74 mg/dl reduction in fasting plasma glucose (FPG), respectively, compared to participants treated with sitagliptin (baseline FPG=169.4 mg/dl, p<0.0001). Overall, participants experienced FPG reductions of 37.4 mg/dl, 46.7 mg/dl, and 20.8 mg/dl on semaglutide 0.5 mg, semaglutide 1.0 mg, and sitagliptin, respectively. End-of-trial 7-point SMPG profiles were lower at every point for participants treated with semaglutide compared to sitagliptin and compared to baseline. 78% of participants in the semaglutide 1.0 mg group and 69% of participants in the semaglutide 0.5 mg group achieved an end-of-trial A1c of <7.0% at 56 weeks, compared to 36% of the sitagliptin-treated group. 66% of the semaglutide 1.0 mg group and 53% of the semaglutide 0.5 mg group achieved a target A1c of ≤6.5% at 56 weeks, compared to 20% of the sitagliptin-treated group.
- 62% of participants on semaglutide 1.0 mg and 46% of participants on semaglutide 0.5 mg achieved ≥5% weight loss, compared to 18% of participants in the sitagliptin group. Furthermore, 24% of participants in the semaglutide 1.0 mg group and 13% of participants in the semaglutide 0.5 mg group experienced even more impressive weight loss of ≥10%, compared to just 3% of the sitagliptin-treated group. Semaglutide 0.5 mg and 1.0 mg produced a 2.37 kg (~5.22 lbs) and 4.22 kg (~9.3 lbs) greater weight loss, respectively, than sitagliptin (p<0.0001). In total, participants on semaglutide 0.5 mg lost a mean 4.3 kg (~9.5 lbs) of body weight while participants on semaglutide 1.0 mg lost a mean 6.1 kg (~13.4 lbs), compared to 1.9 kg (~4.2 lbs) with sitagliptin (baseline body weight=89 kg [~196 lbs]). Like the A1c results, Dr. Ahmann highlighted the early and dramatic divergence in weight loss between the semaglutide and the exenatide groups.
- 74% of participants in the semaglutide 1.0 mg group and 63% of participants in the semaglutide 0.5 mg group achieved a composite endpoint of (i) A1c <7.0%, (ii) no severe or blood-glucose confirmed symptomatic hypoglycemia, and (iii) no weight gain. Only 27% of participants in the sitagliptin-treated group were able to achieve this endpoint. Thus, participants on semaglutide appear 2-3 times more likely to achieve this very clinically relevant composite outcome.
- Overall, serious, and severe adverse event rates were comparable across all three treatment groups, though adverse events leading to discontinuation were higher in the two semaglutide groups. Not surprisingly, Dr. Ahrén attributed the higher discontinuation rate of the semaglutide groups to increased GI side effects – 18% of participants in both semaglutide groups experienced nausea at least once throughout the study (vs. 7% in the sitagliptin group), 13% experienced diarrhea (vs. 7%), and 8%-10% experienced vomiting (vs. 3%). That said, Dr. Ahrén emphasized that the vast majority of cases of nausea were classified as “mild,” the percentage of patients experiencing nausea at any single time point in the study never exceeded 10%, and the percentage of patients experiencing nausea tapered off as the trial progressed. Hypoglycemia, pancreatitis, and malignant neoplasms were similar across all the groups. Participants in the two semaglutide groups experienced a 2 beats/min increase in heart rate, compared to a 1 beat/min increase in the sitagliptin group.
SUSTAIN 2 Results Summary
| Treatment | Semaglutide 0.5 mg | Difference between 0.5 mg and sitagliptin | Semaglutide 1.0 mg | Difference between 1.0 mg and sitagliptin |
|---|---|---|---|---|
| A1c | -1.3% | -0.77%, p<0.0001 | -1.6% | -1.06%, p<0.0001 |
| Fasting Plasma Glucose (FPG) | -37.4 mg/dl | -17.4 mg/dl, p<0.0001 | -46.7 mg/dl | -26.74 mg/dl, p<0.0001 |
| % Achieving A1c <7.0% | 69% | 78% | ||
| % Achieving A1c <6.5% | 53% | 66% | ||
| Weight | -4.3 kg (~9.5 lbs) | -2.37 kg (~5.22 lbs), p<0.0001 | -6.1 kg (~13 lbs) | -4.22 kg (~9.3 lbs), p<0.0001 |
| % Achieving ≥5% Body Weight Loss | 62% | 46% | ||
| % Achieving ≥10% Body Weight Loss | 13% | 24% | ||
| % Achieving A1c <7.0% with no severe/symptomatic hypoglycemia and no weight gain | 63% | 74% |
EFFICACY AND SAFETY OF ONCE-WEEKLY SEMAGLUTIDE VS. EXENATIDE ER IN SUBJECTS WITH TYPE 2 DIABETES (SUSTAIN 3)
Andrew Ahmann, MD (Oregon Health & Science University, Portland, OR)
In the open-label, active-controlled, parallel-group SUSTAIN 3 (n=813) trial, participants treated with semaglutide 1.0 mg experienced a 0.62% greater A1c reduction (p<0.0001) than participants treated with exenatide ER 2.0 mg (AZ’s once-weekly Bydureon). Overall, those in the semaglutide-treated group experienced a mean A1c reduction of 1.5%, compared to a 0.9% reduction in the exenatide-treated group (baseline A1c=8.3%, p<0.0001). Dr. Ahmann emphasized that the A1c curves for the semaglutide and exenatide groups diverged early on and stayed significantly different throughout the trial. End-of-trial 7-point SMPG profiles were lower at every point for participants treated with semaglutide compared to exenatide and compared to baseline, though the difference appeared to be less dramatic than the separation between the semaglutide and sitagliptin SMPG profiles (as expected, given the generally accepted greater glucose-lowering efficacy of GLP-1 agonists compared to DPP-4 inhibitors) – it would have been more helpful from our view to have CGM data. 67% of participants in the semaglutide group achieved an end-of-trial A1c of <7.0% at 56 weeks, compared to 40% of the exenatide-treated group. 47% of the semaglutide group achieved a target A1c of ≤6.5% at 56 weeks, compared to 22% of the exenatide-treated group.
- 52% of participants treated with semaglutide in SUSTAIN 3 achieved ≥5% weight loss, compared to 17% of those treated with exenatide. 21% of semaglutide-treated patients achieved ≥10% weight loss compared to only 4% of exenatide-treated patients. Participants treated with semaglutide experienced a 3.78 kg (~8.3 lbs) greater weight loss than those treated with exenatide (p<0.0001). In total, the semaglutide-treated group experienced a mean weight loss of 5.6 kg (~12.3 lbs) compared to a mean weight loss of 1.9 kg (~4.2 lbs) with exenatide (baseline body weight = 95.8 kg [~211 lbs]).
- With semaglutide treatment, 57% of participants were able to achieve a composite endpoint of A1c <7% with no severe or symptomatic hypoglycemia and no weight gain. This is about twice the proportion of participants in the exenatide-treated group that achieved this composite endpoint (29%).
- Overall adverse events were similar between the semaglutide and the exenatide groups, but serious AEs, severe AEs, and AEs leading to discontinuation were slightly higher in the semaglutide group (9% vs. 7%). This was likely driven by the increased GI side effects seen with semaglutide. In particular, as was previously reported, participants in the semaglutide group experienced almost twice as much nausea as those in the exenatide group (22% vs. 12%). Participants in the semaglutide group also experienced higher rates of diarrhea (11% vs. 8%), decreased appetite (8% vs. 5%), vomiting (7% vs. 6%), dyspepsia (7% vs. 5%), and constipation (6% vs. 5%). The side effect profile is consistent with what has been reported across the SUSTAIN phase 3 development program. Our sense is that semaglutide is a more potent GLP-1 agonist, offering greater A1c and weight loss efficacy – though some suggest it may have an accompanying higher GI side effects, with most in single digits, we’re not too worried about that – although to what degree “hand holding” in the trial would have reduced those reporting nausea etc we don’t know. Either way, there are obviously a high percentage of patients that would seem to be able to benefit from this therapy and we look forward to seeing the move toward the market for it.
SUSTAIN 3 Results Summary
| Treatment | Semaglutide 1.0 mg | Exenatide ER 2.0 mg |
|---|---|---|
| A1c | -1.5% | -0.9% |
| % Achieving A1c <7.0% | 67% | 40% |
| % Achieving A1c <6.5% | 47% | 22% |
| Weight | -5.6 kg (~12.3 lbs) | -1.9 kg (~4.2 lbs) |
| % Achieving ≥5% Body Weight Loss | 52% | 17% |
| % Achieving ≥10% Body Weight Loss | 21% | 4% |
| % Achieving A1c <7.0% with no severe/symptomatic hypoglycemia and no weight gain | 57% | 29% |
SUPERIOR EFFICACY OF ITCA 650 VS. SITAGLIPTIN IN UNCONTROLLED TYPE 2 DIABETES ON METFORMIN: THE FREEDOM-2 RANDOMIZED, DOUBLE-BLIND, 1-YEAR STUDY
Julio Rosenstock, MD (University of Texas Southwestern Medical Center, Dallas, TX)
Dr. Julio Rosenstock presented results from the phase 3 FREEDOM-2 study demonstrating significantly greater A1c reductions (1.5% vs. 0.8%; p<0.001) and weight loss (4 kg vs. 1.3 kg; p<0.001) with Intarcia’s ITCA 650 vs. Merck’s Januvia (sitagliptin). Intarcia announced topline results from the trial in August. The double-blind trial randomized 535 patients with type 2 diabetes on metformin to receive either ITCA 650 + oral placebo or Januvia + implantable placebo for 52 weeks. Patients received the initiation dose of ITCA 650 for 13 weeks and switched to the maintenance dose for the remaining 39 weeks. The A1c difference between the groups was already significant at six weeks and stabilized at week 26; final reductions were 1.5% with ITCA 650 vs. 0.8% with Januvia (baseline = 8.6%-8.7%; p<0.001). ITCA 650 also produced significantly greater reductions in fasting plasma glucose (47 mg/dl vs. 28 mg/dl; p<0.001). Weight loss followed a similar pattern as the A1c reductions, with a fairly early separation that stabilized at around week 26 and remained stable throughout the trial. The final weight reduction was 4 kg (~8.8 lbs) with ITCA 650 vs. 1.3 kg (~2.9 lbs) with Januvia (baseline BMI = 33 kg/m2; p<0.001). ITCA 650 was also superior in terms of the percentage of patients achieving the composite endpoint of A1c reduction >0.5% and weight loss ≥2 kg (61% vs. 28%; p<0.001) and the percentage achieving A1c targets of <7% (61% vs. 42%) and <6.5% (44% vs. 21%). As expected, there were more GI events in the ITCA 650 group, though the discontinuation rates due to these events were low (4.5% for nausea and 2.3% for vomiting). Importantly, the rate of procedure-related adverse events was quite low (<1%) in both groups. Dr. Rosenstock also emphasized that nausea rates peaked when the initial dose was started and when the dose was escalated, but rates were quite low throughout the rest of the trial.
- We are particularly impressed with the durability of the A1c and weight reductions – the difference between the groups held steady from week 26 through the end of the trial. We also found the results for the composite endpoint especially compelling and expect that payers will as well. Intarcia has reported results from three additional trials for ITCA 650: results from FREEDOM-1 and FREEDOM-HBL demonstrating significant A1c reductions vs. placebo were presented at ADA 2015 and topline results from the FREEDOM-CVO trial demonstrating a neutral effect on CV outcomes were announced in May. The impressive efficacy and guaranteed adherence should make ITCA 650 an appealing option for a wide range of patients and could significantly expand use of the GLP-1 agonist class. That said, we would not be surprised if the product’s commercial performance falls somewhat short of the very high expectations some in the field have set for it – the company typically frames ITCA 650 as a completely disruptive innovation for the entire type 2 diabetes market, but we imagine that some patients and providers might be wary of an implanted device or might prefer an agent like Novo Nordisk’s Victoza (liraglutide) with a demonstrated benefit on CV outcomes.
Questions and Answers
Q: Are there any issues around removal in terms of fibrosis?
A: There were no issues of fibrosis. The technique has been highly revised. It’s now done with a delivery device and different tools to ensure the placement is very superficial. Before there was not a tool to really make sure the device was not placed too deep. Now they have a device where you can’t get too deep, so that’s no longer an issue.
Q: Do you have to take the device out to change the dose?
A: Yes. This device could be used for six months, and eventually it will be one year. Taking it out takes less than two minutes.
CLINICAL IMPACT OF TITRATABLE FIXED-RATIO COMBINATION OF TITRATABLE FIXED-RATIO COMBINATION OF INSULIN GLARGINE/LIXISENATIDE VS. EACH COMPONENT ALONE IN TYPE 2 DIABETES INADEQUATELY CONTROLLED ON ORAL AGENTS: LIXILAN-O TRIAL
Julio Rosenstock, MD (University of Texas Southwestern Medical Center, Dallas, TX)
Dr. Julio Rosenstock presented results from the phase 3 LixiLan-O trial demonstrating significantly greater A1c reductions with Sanofi’s iGlarLixi (formerly LixiLan) vs. either of its components in patients with type 2 diabetes on oral agents. Sanofi announced topline results from the trial in July 2015 and the dataset was included in the company’s briefing documents for the recent FDA Advisory Committee meeting for iGlarLixi. The open-label trial randomized 1,170 patients with type 2 diabetes not at goal on metformin and another oral agent to receive either iGlarLixi (n=469), Lantus (insulin glargine; n=467), or lixisenatide (n=234) for 30 weeks. A1c reductions were significantly greater with iGlarLixi (1.6%) vs. both Lantus (1.3%) and lixisenatide (0.9%) (baseline = 8.1%; p<0.0001). A significantly higher percentage of patients achieved an A1c <7% with the combination (74%) compared to Lantus (59%) and lixisenatide (33%). Fasting plasma glucose reductions were comparable with iGlarLixi (62 mg/dl) and Lantus (59 mg/dl) and less impressive with lixisenatide (27 mg/dl) (baseline = 176-178 mg/dl; p<0.0001). As expected, lixisenatide’s greatest contribution was on postprandial glucose. iGlarLixi was superior to both Lantus (by 43 mg/dl) and lixisenatide (by 20 mg/dl) on two-hour postprandial glucose; the combination was superior to Lantus (by 38 mg/dl) but inferior to lixisenatide (by 16 mg/dl) on postprandial glucose excursions. Seven-point glucose profiles showed lower overall glucose throughout the day with iGlarLixi and lower peaks compared to Lantus, especially at breakfast. The combination also demonstrated a 1.4 kg weight benefit compared to Lantus and allowed a significantly higher percentage of patients to achieve the composite endpoint of A1c <7% with no weight gain (43% vs. 25% with Lantus and 28% with lixisenatide).
- Especially relevant in light of the AdComm discussion, Dr. Rosenstock highlighted the potential for dosing flexibility with the two iGlarLixi pens. Sanofi plans to market iGlarLixi in two pens, one (pen A) with a 2:1 insulin glargine/lixisenatide ratio and insulin doses ranging from 10-40 U/day and another (pen B) with a 3:1 insulin glargine/lixisenatide ratio and insulin doses ranging from 40-60 U/day. Dr. Rosenstock emphasized that this allows insulin titration up to 60 U without going above the maximum dose of 20 mcg lixisenatide. Data on the final dose distribution in LixiLan-O showed that 56% of patients achieved good control with pen A, 44% required intensification to pen B, and only 8% reached the maximum dose of 60 U without achieving target. A number of panelists at the AdComm meeting expressed concerns about distinguishing between the two pens and about the nomenclature of “units” used to dose the combination. These concerns were fairly unexpected to us, and we hope Sanofi and the FDA can work together to resolve them in short order.
- Adverse events were generally similar between groups in the trial. Nausea rates were substantially lower with iGlarLixi (9.6%) compared to lixisenatide (24%), confirming one of the main expected with these combinations compared to GLP-1 agonists alone. Dr. Rosenstock highlighted the fact that only 0.4% of the iGlarLixi group discontinued treatment due to nausea (compared to 2.6% in the lixisenatide group). The rate of documented symptomatic hypoglycemia was low and comparable between the iGlarLixi and Lantus groups (1.4 vs. 1.2 events/patient-year).
Questions and Answers
Q: Given the short duration of action of lixisenatide, might it make more sense to use it twice a day?
A: That sounds like common sense but you don’t need to. With the results you get, why would you need to? You get an effect on postprandial glucose mainly in the morning, you do have some carry over for lunch, and by dinner there’s not much, but you get down to 6.5%. We shouldn’t use it twice a day because it’s not approved.
Q: Would you use it twice a day if A1c deteriorates over time?
A: I don’t know. We need longer-term studies.
Q: I’d like to see a study where you challenge the fixed-ratio combination not only to glargine + lixisenatide but to degludec + liraglutide, comparing the fixed ratio with split injections. I think it would highlight the convenience of the fixed ratio and on the other side the ability to individualize the combination because we know patients have different characteristics.
A: There’s no question that what you suggest would be a nice study. The question is whether simultaneous therapy is better than sequential. All these years we’ve done sequential. We have a bit of indirect evidence on this from GetGoal Duo 1, where patients were on basal insulin for 12 weeks and then added lixisenatide. That got people down to 7% and here we got down to 6.5%. The important bottom line is that we get down to 6.5%. The same was true with IDegLira. Both combinations get people down to levels we were never able to get before with any of the components alone.
Q: What concentration of insulin glargine was used?
A: U100.
Oral Presentations: Beyond Basal Insulin in Type 2 Diabetes – Treatment Intensification Options
EFFICACY AND SAFETY OF THE INSULIN GLARGINE/LIXISENATIDE FIXED-RATIO COMBINATION VS. INSULIN GLARGINE IN PATIENTS WITH T2DM: THE LIXILAN-L TRIAL
Vanita Aroda, MD (MedStar Health Research Institute, Hyattsville, MD)
Dr. Vanita Aroda presented results from the phase 3 LixiLan-L trial demonstrating significantly greater A1c reductions with Sanofi’s iGlarLixi (formerly LixiLan) vs. Lantus (insulin glargine) in patients with type 2 diabetes on basal insulin, driven by improvements in postprandial glucose. Sanofi announced topline results from the trial in September 2015 and the dataset was included in the company’s briefing documents for the FDA Advisory Committee meeting for iGlarLixi. The open-label trial randomized 736 patients not at goal on basal insulin and oral drugs to treatment with iGlarLixi (n=367) or Lantus (n=369) for 30 weeks. The insulin glargine dose in both groups was titrated to a fasting glucose target of 80-100 mg/dl and the dose was capped at 60 U/day (to match the maximum dose in the combination). A1c reductions were significantly greater with iGlarLixi (1.2%) than Lantus (0.6%) (baseline = 8.1%). A significantly higher percentage of patients achieved an A1c <7% with iGlarLixi (55%) than with Lantus (30%; p<0.0001). Fasting plasma glucose reductions were similar in both groups (21 mg/dl vs. 23 mg/dl), as expected given the almost identical average daily doses of insulin glargine at the end of the trial (46 vs. 47 U). The main contribution of lixisenatide to the combination was on postprandial glucose: iGlarLixi produced significantly greater reductions in both two-hour postprandial glucose (85 mg/dl vs. 25 mg/dl) and postprandial excursions (70 mg/dl vs. 8 mg/dl) compared to Lantus. Seven-point glucose profiles illustrated this improvement in postprandial control, particularly after breakfast. iGlarLixi led to a 1.4 kg weight benefit and comparable hypoglycemia rates to Lantus. The combination also allowed a greater percentage of patients to achieve an A1c <7% without weight gain (34% vs. 13%), an A1c <7% without hypoglycemia (32% vs. 19%), and an A1c <7% without weight gain or hypoglycemia (20% vs. 9%) – while the benefit is encouraging, the low absolute percentages in both groups illustrate the remaining need for more effective therapies.
Questions and Answers
Q: Do you think the weight loss is less when lixisenatide is used in combination with insulin vs. separately when added to insulin or without insulin?
A: I would refer you to the LixiLan-O trial, where we saw greater weight loss with lixisenatide alone. Here we have mitigation of the weight gain with insulin glargine.
Q: But the average weight loss seems to be less here than when you add on a GLP-1 agonist without insulin or even separately.
A: Part of it might be the final dose, which was 17 mcg of lixisenatide on average.
Q: I’m guessing the combination was administered before breakfast. Was the administration of glargine alone done at the same time?
A: Glargine could be administered at any time and it was consistent throughout the trial. The combination was injected an hour before breakfast.
Q: From the seven-point profile, it’s obvious that the main effect is on that first meal, yet it was a fixed schedule of dosing before breakfast. Do you think the results would be different if it was administered with the largest meal rather than breakfast? My patients don’t all eat breakfast, and dinner is typically the biggest meal in the US.
A: That’s an intriguing question that can only be answered by a trial. There was a sub-study looking at dosing at the main meal vs. the morning and the main effect seems to be in the morning, but we would need a trial to know.
Q: You didn’t save a single dose of insulin by adding lixisenatide and you had the same rate of hypoglycemia. Is there any information on the PK/PD data? Were the profiles of both components really preserved? It seems like a very weak effect.
A: The PK data were consistent with what was seen in the lixisenatide standalone program. Your point is appreciated that there’s not necessarily an insulin-sparing effect. I would also state here that we had a greater A1c reduction down to 6.9% without increased hypoglycemia. We’re looking at two different end A1cs with comparable hypoglycemia.
Q: Looking at the meal data in the control group, you still have glucose values of 230 mg/dl two hours after a meal – people are clearly not well controlled. Would you anticipate different results if you had a more well-controlled group?
A: The 230 mg/dl was from a mechanistic substudy highlighting the mechanism of action of iGlarLixi on postprandial glucose. The 7-point SMPG, reflective of control in the comparator group, showed the control we typically see with titration with insulin glargine (postprandial glucose of 160s-190s during the day). This, along with detailed review of titration, superimposable fasting glucoses, and insulin doses all support appropriate titration in the control group.
IMPROVED GLYCEMIC CONTROL AND WEIGHT LOSS WITH ONCE-WEEKLY DULAGLUTIDE VS. PLACEBO, BOTH ADDED TO TITRATED DAILY INSULIN GLARGINE, IN TYPE 2 DIABETES PATIENTS (AWARD-9)
Paolo Pozzilli, MD (University Campus Bio-Medico, Rome, Italy), City, State/Country)
In front of a standing-room-only crowd, Dr. Paolo Pozzilli presented the results of AWARD-9, a double-blind, 28-week superiority trial comparing the effects of dulaglutide (Lilly’s Trulicity) vs. placebo on A1c and weight when added to insulin glargine in patients with type 2 diabetes. The trial randomized 300 patients with inadequate glycemic control (A1c 7-10.5%) to dulaglutide 1.5mg (n=150) or placebo (n=150) on top of once-daily glargine titrated to a FPG target of 71-99 mg/dl (± metformin). Baseline characteristics were similar between both groups (please see below). Data at 28 weeks showed that compared to placebo, dulaglutide provided significantly greater reductions in A1c (0.67 vs. 1.44, respectively), and in fasting serum glucose (28 vs. 45 mg/dl, respectively; p<0.001 for both comparisons). No difference in the rate of hypoglycemia was observed. Patients on dulaglutide experienced a weight loss (4.2 lbs [1.91 kg]), compared to a weight gain with placebo (1.1 lbs [0.50 kg]; p<0.001). In addition, insulin glargine requirements were statistically significantly lower in the dulaglutide group (13U) versus the placebo group (26U).
- The rate of retention was similar between the dulaglutide and placebo groups (92% and 89%, respectively). The two groups also had similar baseline characteristics, with an average age of 60 years, percent female of 41-43%, percent Caucasian of 92-95%, BMI of 33 kg/m2, diabetes duration of 13 years, A1c of 8.3-8.4%, fasting serum glucose of 156-157 mg/dl, and percent on metformin of 87-89%.
- Table 1: 28-week data on the effect of dulaglutide vs. placebo on glucose measurements, weight, and glargine requirements.
| Primary Endpoint | Dulaglutide | Placebo | Difference | p value |
|---|---|---|---|---|
| A1c reduction (%) | 1.44 | 0.67 | 0.77 | p <0.001 |
| % pt with A1c <7% | 69% | 35% | -- | p <0.001 |
| % pt with A1c <6.5% | 51% | 17% | -- | p <0.001 |
| Reduction in FSG (mg/dl) | 45 | 28 | 17 | p <0.001 |
| Weight change | -1.91 kg (4.2 lbs) | +0.50 kg (1.1 lbs) | -2.41 kg (5.3 lbs) | p <0.001 |
| Change in glargine dose | 13U | 26U | -13U | p <0.001 |
- The dulaglutide and placebo groups had similar rates of overall hypoglycemia (82% vs. 76%, respectively), documented symptomatic hypoglycemia (53% vs. 45%, respectively), and nocturnal hypoglycemia (42% vs. 43%, respectively). The dulaglutide group had one episode of severe hypoglycemia, compared to zero in the placebo group.
- Regarding adverse events, more gastrointestinal symptoms were observed in the dulaglutide groups. Dr. Pozzilli noted that these events only led to discontinuation of therapy in very few patients.
Questions and Answers
Q: Can you give us an idea on how the insulin was adjusted?
A: The basal insulin glargine dose was given according to the classical algorithm used for a patient with basal-only insulin. It was then titrated by 2 units.
Q: You had a baseline A1c of 8.4%, which came down to 6.92 – so about 7. But you only had a fraction of people achieve an A1c <7%, suggesting that there were nonresponders. Did you look at those non-responders?
A: The patients had an excellence response if you look at the standard deviation. You see that there is minimal variation, suggested that nearly all the patient responded to therapy. The difference between the two groups was highly significant between the two groups.
Q: Dr. Stephano Del Prato: There is something that is not completely clear to me. People in the placebo group required 26 more units of glargine compared to 13 units for dulaglutide, yet there was no difference in the rate of hypoglycemia. What is the explanation? Because one of the things that we have been exposed to is that the combination of insulin plus a GLP-1 agonist often comes with a reduction in hypoglycemia. Is it because of the titration?
A: Yes, I think it is the titration.
Dr. Stephano Del Prato: Do you have the time course of the hypoglycemic events?
A: [Dr. Pozzilli showed the slide with the hypoglycemia data, which is written in an above bullet point].
COMPARISON BETWEEN SGLT2 INHIBITORS AND DPP-4 INHIBITORS ADDED TO INSULIN THERAPY IN TYPE 2 DIABETES: A SYSTEMATIC REVIEW WITH INDIRECT COMPARISON META-ANALYSIS
Se Hee Min, MD (Seoul National University Hospital, Seoul, South Korea)
Dr. Se Hee Min presented the results of an indirect meta-analysis that compared the effect of SGLT-2 inhibitors plus insulin (SGLT-2i/INS) vs. DPP-4 inhibitors plus insulin (DPP-4i/INS) in type 2 patients. The group performed a systematic review that yielded 14 studies which investigated either SGLT-2i/INS vs. placebo/INS or DPP-4i/INS vs. placebo/INS (5 and 9 studies, respectively). Results of the covariate-adjusted indirect comparison using meta-regression analyses showed that SGLT-2i/INS provided greater reductions in A1c (weighted mean difference [WMD] of -0.24%; 95% CI: -0.43 to -0.05%), as well as greater reductions in fasting plasma glucose (WMD -18.0; 95% CI: -28.5 to -7.6 mg/dl) and body weight (WMD -2.38 kg [lbs]; 95% CI: -3.18 kg [7.0 lbs] to -1.58 kg [3.5 lbs]). No difference in hypoglycemia was observed with SGLT-2i/INS compared to DPP-4i/INS (RR 1.19; 95% CI: 0.78-1.82). Dr. Min remarked that in the absence of head-to-head comparisons, these results could serve as the best available evidence for selecting oral agents in patients uncontrolled on insulin.
- Dr. Min noted that her group focused on SGLT-2 inhibitors and DPP-4 inhibitors because the drugs do not require injections and do not contribute to significant weight gain. Thus, the team views them as preferable add-on agents compared to GLP-1 agonists and TZDs. Furthermore, Dr. Min highlighted that SGLT-2 inhibitors and DPP-4 inhibitors have complementary effects to insulin with regards to hypoglycemia and weight gain.
- To perform their systematic review, Dr. Min and colleagues searched Medline, Embase, LILACS, the Cochrane Central Register of Controlled Trials, and ClinicalTrials.gov for randomized controlled trials before June 2015 that compared either SGLT-2i/INS vs. placebo/INS or DPP-4i/INS vs. placebo/INS. They included only trials that were ≥12 weeks long and that measured A1c as an endpoint. The searches yielded 14 trials – five SGLT-2 inhibitor studies and nine DPP-4 inhibitor studies.
- The indirect analysis involved comparing each drug’s efficacy over placebo. After the initial evaluation yielded no differences between SGLT-2i/INS and DPP-4i/INS, the authors performed a meta-regression that guided a subsequent covariate adjustment, which yielded the results presented above.
Questions and Answers
Q: The DPP4i/INS studies generally looked at a single dose while the SGLT-2i/INS studies usually had a lower dose and a higher dose. Did you include both doses or the maximum dose?
A: We included the data from the maximum approved dose.
Q: I’m not sure if you could do this because you would need patient-level data, but would you consider comparing the two drugs by baseline A1c category?
A: Thank you for your question. We did not stratify the patients by A1c.
Posters
EFFECT OF ERTUGLIFLOZIN PLUS SITAGLIPTIN ON GLYCEMIC CONTROL VS. EITHER TREATMENT ALONE IN SUBJECTS WITH T2DM INADEQUATELY CONTROLLED WITH METFORMIN (125-LB)
R Eldor, R Pratley, G Golm, S Huyck, Y Qiu, S Sunga, J Johnson, S Terra, J Mancuso, S Engel, B Lauring
Dr. Eldor and colleagues presented interim, 26-week results from an ongoing 52-week randomized, double-blind, phase 3 trial comparing the safety and efficacy of Merck/Pfizer’s ertugliflozin plus sitagliptin (Merck’s Januvia) versus either drug alone in patients with type 2 diabetes. The study recruited 1,233 patients inadequately controlled (A1c 7.5-11%) on stable metformin (≥8 wks at ≥1,500 mg/day), who were randomized to one of five groups: ertugliflozin 5mg or 15mg daily plus sitagliptin 100mg daily, ertugliflozin 5mg or 15mg daily alone, or sitagliptin 100mg daily alone. Data at 26 weeks showed that co-administration of ertugliflozin with sitagliptin led to significantly greater reductions in A1c (1.5% for both groups) compared to either drug alone (1%-1.1% across the three groups; p<0.002). A similar effect was observed with fasting plasma glucose and percentage of patients achieving A1c <7%. Co-administration also led to significantly greater reductions in body weight and systolic blood pressure compared to sitagliptin alone. Static beta-cell responsivity increased across all treatment arms and no difference was observed with the co-administration groups.
- The retention rate across all groups at 26 weeks was 92-96%. The authors provided the ranges of baseline characteristics across all five groups: average age of 55 years, % male of 51-62%, mean A1c of 8.50-8.57%, duration of T2DM of 6-7 years, eGFR of 92 mL/min/1.73m2, weight of 88-90 kg [194-198 lbs], and BMI of 32-33 kg/m2.
Table 1: Data from 26 weeks showing greater reductions in A1c, FPG, weight, and SBP with combined ertugliflozin + sitagliptin versus either drug alone.
| Reduction from baseline: | ERTU 5mg | ERTU 15mg | SITA 100mg | ERTU 5mg + SITA 100mg |
|---|---|---|---|---|
| n | 250 | 248 | 247 | 243 |
| A1c (%) | 1 | 1.1 | 1.1 | 1.5* |
| FPG (mg/dl) | 35.5 | 37.1 | 25.9 | 44.4* |
| Body weight | 2.7 kg [6.0 lbs] | 3.7 kg [8.2 lbs] | 0.7 kg [1.5 lbs] | 2.5 kg# [5.5 lbs] |
| SBP | 3.9 | 3.7 | 0.7 | 3.4# |
| Pt with A1c <7% | 66 (26%) | 79 (32%) | 83 (34%) | 127 (52%)∏ |
* p<0.002 vs. individual treatments
# p<0.005 vs. sitagliptin treatments (comparisons to ertugliflozin alone were not performed)
∏ p<0.001 based on model-estimated odds ratio comparing ERTU+SITA vs. individual treatments
- The safety profiles were similar between the five groups, with the exception of a higher observed rate of genital mycotic infections in the groups that included ertugliflozin. The authors note that there was no meaningful difference in urinary tract infection incidence between the groups, and that the rate of hypovolemia and symptomatic hypoglycemia were low across treatment groups.
ERTUGLIFLOZIN EFFECTIVELY IMPROVES GLYCEMIC CONTROL AS MONOTHERAPY IN PATIENTS WITH T2DM (130-LB)
S Dagogo-Jack, M Davies, J Frias, G Derosa, A Darekar, K Focht, G Golm, J Johnson, D Saur, S Terra
Dr. Dagogo-Jack and colleagues presented interim, 26-week results from the ongoing 52-week, randomized, double-blinded, phase 3 VERTIS MONO trial investigating the safety and efficacy of Merck/Pfizer’s ertugliflozin in patients with type 2 diabetes. The study recruited 461 patients with inadequate glycemic control on diet and exercise (A1c 7-10.5% with no anti-diabetic agents taken within 8 weeks of starting the study), who were randomized to placebo (n=153), ertugliflozin 5mg daily (n=156), or ertugliflozin 15mg daily (n=152). Twenty-six-week data showed that both ertugliflozin doses provided statistically significantly greater A1c reductions vs. placebo (0.99% for the 5mg dose and 1.16% for the 15mg dose); similar results were observed for fasting plasma glucose, body weight, and 2-hour post-prandial glucose. In addition, a greater proportion of patients achieved an A1c <7% in the ertugliflozin groups vs. placebo.
- Participants who met glycemic rescue criteria received open-label metformin. The FPG thresholds for rescue were >270 mg/dl from day 1 to week 6; >240 mg/dl from week 6 to week 12; and >200 mg/dl from week 12 to 16. The placebo group had a higher rate of patients receiving glycemic rescue (26%) compared to the ertugliflozin 5mg (2%) and 15mg group (3%).
- The three groups had comparable baseline characteristics, with an average age of 56-57 years, % male of 54-59%, duration of type 2 diabetes of 5 years, body weight of 91-94 kg [201-207 lbs], BMI of 33 kg/m2, A1c of 8.1-8.4%, FPG of 179-181 mg/dl, baseline 2-hr PPG of 256-263 mg/dl, SBP of 130 mmHg, DBP of 78-79 mmHg, and eGFR of 86-89 mL/min/1.73m2.
- The retention rate through week 26 was 90% across the three groups and 83% for the study drug.
- Table 1: Change in A1c from baseline to 26 weeks
|
Treatment |
Baseline |
Week 26 |
Change from baseline to wk 26 |
|||
|---|---|---|---|---|---|---|
|
|
n |
Mean |
n |
Mean |
n |
Mean |
|
Placebo |
153 |
8.11 |
89 |
7.76 |
153 |
-0.09 |
|
Ertugliflozin 5mg |
155 |
8.16 |
133 |
7.31 |
156 |
-0.80 |
|
Ertugliflozin 15mg |
151 |
8.35 |
124 |
7.28 |
151 |
-1.04 |
- Table 2: Results of primary and secondary endpoints at 26 weeks.
|
Endpoint |
Ertugliflozin 5mg vs. placebo |
Ertugliflozin 15mg vs. placebo |
||
|---|---|---|---|---|
|
|
Difference# |
p value |
Difference# |
p value |
|
A1c (%) |
-0.99 |
p<0.001 |
-1.16 |
p<0.001 |
|
FPG (mg/dl) |
-34.5 |
p<0.001 |
-44.0 |
p<0.001 |
|
Body Weight |
-1.76 kg [3.9 lbs] |
p<0.001 |
-2.16 kg [4.8 lbs] |
p<0.001 |
|
2-h PPG (mg/dl) |
-69.0 |
p<0.001 |
-67.3 |
p<0.001 |
|
SBP (mmHg) |
-3.31 |
0.015* |
-1.71 |
0.213 |
|
DBP (mmHg) |
-1.80 |
0.039* |
-0.37 |
0.669* |
|
|
Odds Ratio |
p value |
Odds Ratio |
p value |
|
Proportion of pt with A1c <7% |
3.6 |
p<0.001 |
6.8 |
p<0.001 |
* Nominal p value
# Difference in least squares means based on a constrained longitudinal data analysis model
- Regarding adverse events, genital mycotic infections were more common in female participants receiving ertugliflozin vs. placebo. In male participants, genital mycotic infections were numerically higher with ertugliflozin vs. placebo. The incidence of UTI was numerically highest in the placebo group. Furthermore, the rates of symptomatic hypoglycemia and hypovolemia were similar between the three groups.
The Value of Continuous Glucose Monitoring in Patients with Type 1 Diabetes Using Multiple Daily Injections – DIaMonD Study
RESULTS
Elena Toschi, MD, PhD (Joslin Diabetes Center, Boston, MA)
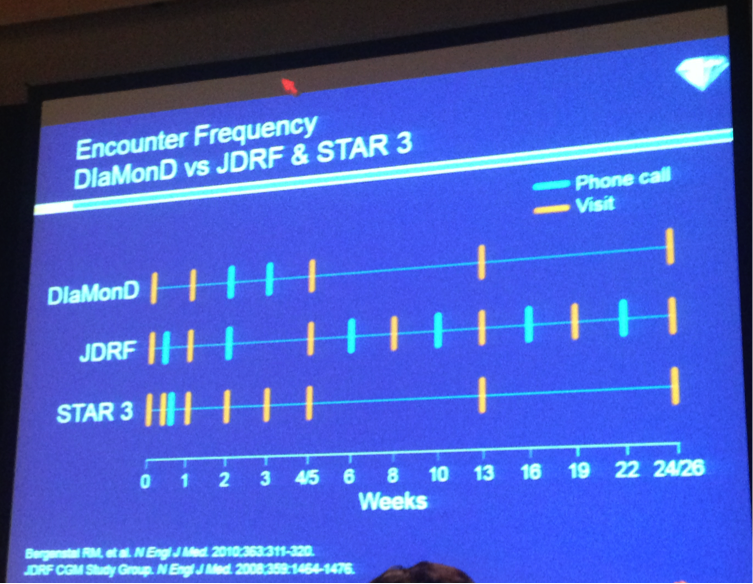
Joslin’s Dr. Elena Toschi reported very positive results from Dexcom’s DIaMonD study, which randomized MDI users not at goal (baseline A1c: 8.6%) to six months of CGM (n=105) or six months of usual care (n=53). A1c declined a strong 0.9% with CGM at six months vs. -0.4% with usual care, for an adjusted mean difference of -0.6% in favor of CGM (p<0.001). The advantage for CGM was impressively consistent across age, baseline hypoglycemia, education, and diabetes numeracy – 60+ year-old CGM users saw the same benefit as 25-60 year-old users! At the same time A1c declined, hypoglycemia significantly improved with CGM: a 30% improvement in time <70 mg/dl (-23 mins/day; p=0.006) and a strong 50% improvement in time <50 mg/dl (-11 mins per day; p=0.005), both outperforming 17% and 21% improvements with usual care (-15 mins, -6 mins). While the absolute reductions are not huge here, we’d note the high baseline patients were not experiencing an overwhelming amount of hypoglycemia at baseline. On the high end, CGM users were spending 83 fewer minutes per day above range (>180 mg/dl) at 24 weeks, while the usual care group was spending nine more minutes per day above range (p=0.04). That translated to CGM users spending an hour more per day in range (70-180 mg/dl ) at 24 weeks, while the usual care group spent 15 fewer minutes per day in range (p=0.006). CGM trended towards less severe hypoglycemia: a 2% rate (two out of 105 patients) vs. a 4% rate in usual care (two out of 53 patients). Glycemic variability also significantly improved with CGM (median CV: 42% to 38%), but did not change in usual care (42% to 42%) (p<0.001). Daily SMBG tests declined as expected in the CGM group (from 5.1/day to 3.6/day), but stayed roughly similar in the usual care group (5.1/day to 4.6/day) (p<0.001). CGM wear >6 days per week was seen in an impressive 89% of patients at six months, a testament to the better technology and the tight adherence criteria (>85% wear) patients had to demonstrate during the blinded CGM phase before randomization – that ensured, of course, that patients would actually wear CGM and see benefit during the study. The presentation only said the “latest” Dexcom CGM was used, which we assume means the G4 sensor with Software 505. More study details below!
- Overall, these are very strong and positive results for Dexcom and the entire CGM field, which has primarily shown data over the years in patients using pumps – clearly the group that can benefit from CGM is much larger. DIaMonD shows that MDI users not at glycemic target can get a meaningful reduction in A1c (-0.9% from baseline), shave off highs, cut their time in mild and dangerous hypoglycemia, and improve variability. We hope this large randomized study can help influence more prescribing of CGM in MDIs, and more importantly, influence professional guidelines. DIaMonD is also a milestone for Dexcom, who has never run an outcomes study, and will need to do more to keep up with Medtronic’s and Abbott’s growing lists. This study enrolled some patients with type 2 and collected healtheconomic data, but neither was presented today – we look forward to seeing much more on this front. Phase 2 of the study will cross some of the MDI patients over to pumps, so we’ll eventually see if insulin delivery method makes a difference. The power of CGM to drive therapeutic change is obviously very high and we also look forward to learning more about what is the best method to identify and drive change.
A1c Results
- A1c declined 0.9% with CGM at six months vs. -0.4% with usual care, for an adjusted mean difference of -0.6% in favor of CGM (baseline: 8.6%; p<0.001). The effect was similar at 12 and 24 weeks, suggesting the benefits occurred quickly and were maintained at six months.
|
|
Baseline |
Week 12 |
Week 24 |
|
|---|---|---|---|---|
|
CGM |
8.6% |
7.6% |
7.7% |
P<0.001 |
|
Usual Care |
8.6& |
8.1% |
8.2% |
-
- CGM’s A1c advantage rose to -0.8% vs. usual care in those with a baseline A1c >8.5% (-1.3% vs. -0.5% from baseline-24 weeks), and a -0.4% A1c advantage in those with a baseline A1c <8.5% (-0.6 vs. -0.2% from baseline-24 weeks).
- Notably, the A1c results were consistent across age: 60+ year-old CGM users saw a -1.0% A1c improvement from baseline, the same as 25-60 year-old users. The usual care group also saw the same -0.4% A1c change in both age groups.
- A notable 52% of CGM users saw an A1c reduction of >1% compared to only 19% of the usual care group(p<0.001). Only 18% of the CGM group got to an A1c <7%, though that quadrupled the 4% of patients that did so in the usual care group (p=0.02). This was not too surprising, as patients started at a very high baseline (8.6%), making an A1c <7% difficult to achieve. We’ll be very eager in the future to better understand what drives success once patients have a full picture of their glycemic profile.
Time In Range Results
- At 24 weeks, CGM users were spending an extra hour per day in range (70-180 mg/dl ) from baseline, while the usual care group spent 15 minutes fewer per day in range (p=0.006). This translated to an 11% improvement in time-in-range for the CGM group vs. a 2% decrement in the usual care group.
|
Minutes Per Day in 70-180 mg/dl |
|||
|---|---|---|---|
|
|
Baseline |
Week 24 |
Change |
|
CGM |
662 |
734 |
+61 minutes +11% |
|
Usual Care |
648 |
633 |
-15 minutes -2% |
Hypoglycemia Results
- Hypoglycemia significantly improved with CGM, including a 30% improvement in time <70 mg/dl (p=0.006) and a strong 50% improvement in time <50 mg/dl (p=0.005); both outperformed 17% and 21% improvements, respectively, in the usual care group. Time in hypoglycemia was relatively low in both groups at baseline (~5% of the day – an artifact of the high A1c baseline), so there wasn’t a huge runway to improve here. [For comparison, Abbott’s IMPACT study saw three hours per day in hypoglycemia at baseline stemming from the 6.7% starting A1c, while this study saw ~1-1.5 hours per day.] There was a slight imbalance at baseline, as the usual care group saw more hypoglycemia, and thus, had more room to improve during the study. Still, the relative improvement was nearly twice as big with CGM for <70 mg/dl, and more than twice as big for <50 mg/dl.
|
Minutes Per Day <70 mg/dl |
|||
|---|---|---|---|
|
|
Baseline |
24 weeks |
Change |
|
CGM |
76 |
53 |
-23 minutes -30% |
|
Usual Care |
90 |
75 |
-15 minutes -17% |
|
Minutes Per Day <50 mg/dl |
|||
|---|---|---|---|
|
|
Baseline |
24 weeks |
Change |
|
CGM |
22 |
11 |
-11 minutes -50% |
|
Usual Care |
29 |
23 |
-6 minutes -21% |
- CGM drove a 79% reduction in nocturnal hypoglycemia (<60 mg/dl) vs. a 40% improvement for usual care (p=0.005). Daytime hypoglycemia was halved with CGM vs. no change in usual care (p=0.02). Again, the amount of hypoglycemia was pretty low here, but like automated insulin delivery, CGM really offers benefits at night.
|
Nighttime % of Readings <60 mg/dl |
|||
|
|
Baseline |
24 weeks |
Change |
|
CGM |
2.9% |
0.6% |
-79% |
|
Usual Care |
4.0% |
2.4% |
-40% |
Hyperglycemia Results
- At 24 weeks, CGM users were spending 83 fewer minutes per day above range (>180 mg/dl ) from baseline, while the usual care group spent nine more minutes per day above range (p=0.04). This translated to a 12% improvement in time-above-range for the CGM group vs. a 1% decrement in the usual care group.
|
Minutes Per Day >180 mg/dl |
|||
|
|
Baseline |
24 weeks |
Change |
|
CGM |
687 |
604 |
-83 minutes -12% |
|
Usual Care |
725 |
734 |
+9 minutes +1% |
Other Results
- Glycemic variability significantly improved with CGM (median CV: 42% to 38%), but did not change in usual care (42% to 42%) (p<0.001). We wish the investigators had shown modal day plots, but perhaps the difference would have been difficult to detect graphically.
-
CGM trended towards less severe hypoglycemia: a 2% rate (two out of 105 patients) vs. a 4% rate in usual care (two out of 53 patients). This was not a focus of the commentary or conclusions, though it implies less severe hypoglycemia in the CGM group – a long sought after end point, and a clear coup on the payer front. There was no p-value on the slide, and presumably a larger and longer study with a hypoglycemia-enriched population would be needed to show a significant benefit on severe hypoglycemia.
- There were no DKA events in either group.
- Daily SMBG test declined by 24 weeks in the CGM group (from 5.1/day to 3.6/day), but stayed roughly similar in the usual care group (5.1/day to 4.6/day) (p<0.001). This is to be expected with CGM, and though insulin-dosing data was not collected, we assume many patients were using readings to dose insulin without a confirmatory fingerstick.
-
DIaMonD saw very good CGM adherence: at week 24, 89% of patients were using CGM >6 days per week. This was fairly consistent with week 4 (94%), down very slightly from week 12 (96%), but better than other studies like STAR-3 (23% adherence on Dr. Wolpert’s slide).
- In hallway chatter, some pointed out that the pre-randomization criteria required >85% adherence to the blinded CGM during the run-in, ensuring patients would stick with the technology once in the study. This could detract from the “real-world” aspect of the study, though we’ll be interested to hear more commentary.
- All study results were intention to treat, and DIaMonD saw outstanding retention: of 105 enrolled in the CGM arm, 103 completed the study (98%). Of 53 enrolled in usual care, 53 completed the study (100%). What a way to run a trial!
Study Background and Baseline Characteristics
- The 24-site US study included patients with a mean age of 48 years, a mean A1c of 8.6%, and a mean BMI of 28 kg/m2 at baseline. Eleven percent of patients had a severe hypoglycemia event in the last 12 months, and 1% had DKA in the last 12 months. The study population was 44% female, 84% white, and 44% had less than a bachelor’s degree.
-
The DIaMonD study randomized MDI users (n=158) not at A1c goal (baseline: 8.6%) to six months of CGM (n=105) vs. six months of usual care (n=53). After a screening period, a two-week run-in with blinded CGM established baseline glycemia in both groups. Patients were then randomized to 24 weeks of CGM vs. usual care (continued SMBG) for 24 weeks. Two cohorts were included – type 1 and type 2 – though only type 1 data was reported today. Healtheconomic data was also collected in phase 1, though not included today. In phase 2 of the study, patients on MDI will switchover to a pump to see if there are any benefits to change insulin delivery method.
- The study design limited clinical encounters to ensure real-world outcomes. Weeks 1-3 included device initiation, and the CGM group had a clinic visit at week 1 to troubleshoot the device. Both groups received phone calls in weeks 2-3. At weeks 4 and 12, diabetes management visits occurred, and the clinician downloaded devices and reviewed glucose data (either CGM or SMBG) and made insulin adjustments per usual care in both groups. The usual care group had clinic visits to place a blinded CGM placed at weeks 11 and 23. All patients received one initial session of general diabetes education, and the CGM group received some basic advice on how to use CGM data, adjust insulin doses based on trends, etc.
DISCUSSION
Howard Wolpert, MD (Joslin Diabetes Center, Boston, MA)
Dr. Howard Wolpert succinctly summarized the positive implications of the DIaMonD study results: “Clinicians should consider recommending CGM to all patients with type 1 diabetes who have not attained their glycemic goals.” Presumably glycemic goals are A1cs about 7%, or A1cs below 7% with too much hypoglcyemia though this was not discussed at length. He noted the consistency of these A1c outcomes with the JDRF CGM trial and STAR-3 trials (~0.5% reduction). However, this trial was more real world, with fewer visits and phone calls than in either the JDRF or STAR-3 trials – see the picture below. He also pointed out the high sensor adherence (>6 days per week) in DIaMonD, which exceeded usage in other CGM studies (in STAR 3, only 23% used the CGM >80% of the time) – this is expected as sensors improve (this would also have exceeded adherence using the STS, for example, of the Seven, old Dexcom sensor platforms. CGM compliance, said Dr. Wolpert, is all about the tradeoff between benefits and demands – with better technology now (accurate, reliable, easier to use), the benefits are starting to outweigh the hassles for more patients. Indeed, Dr. Wolpert characterized the glucose-monitoring field as “at an inflection point.” The transition from urine testing to intermittent fingersticks in the DCCT era reduced A1c, but increased hypoglycemia. Now we’re making the transition from intermittent fingersticks to CGM, which reduces A1c and brings fewer hypoglycemia events. To close his remarks, Dr. Wolpert noted that among MDI users in the T1D exchange, 93% are using SMBG alone, and only 7% are using CGM. This large randomized study supports the benefits of CGM in those on MDI, and we expect it to drive further penetration of the technology in MDIs.
Posters
ACCURACY OF A FOURTH-GENERATION GLUCOSE SENSOR THROUGHOUT ITS FUNCTIONAL LIFE (897-P)
R Brazg, M Christiansen, B Bode, T Bailey, S Garg, R Slover, S Huang, J Shin, S Lee
Medtronic presented accuracy data from a pivotal study of its fourth-generation sensor (Enlite 3), to be used with the MiniMed 670G or the Guardian Connect mobile app. The new sensor demonstrated an overall MARD of ~10.5% vs. YSI values measured on days one, three, and seven at 12-hour in-clinic visits (an impressive 23,709 total paired CGM-YSI points). MARD was ~13% on day 1, ~9% on day 3, and ~10% on day 7, with an equal balance of data points collected on each day. Eight-nine participants took part in the study, each wearing two sensors on the abdomen (one paired to the 640G pump and one paired to Guardian Connect mobile app; we have averaged the data for brevity). Enlite 3 was calibrated once at the start of every 12-hour in-clinic visit, and not again unless the device asked for a smart calibration. A separate poster showed that 13% of glucose values (YSI) were collected <75 mg/dl, 56% were 76-180 mg/dl, and 31% were >180 mg/dl. Of the 89 study participants, 26 had type 2 diabetes (of whom 16 did not require insulin). Overall, this sensor is a clear improvement over Enlite and Enlite Enhanced, and we’ve heard from 670G trial participants that it is a big upgrade. How it compares to Dexcom and Abbott’s accuracy and reliability is an unknown, but we’re glad to see Medtronic making strides. At some point, further improvements in accuracy (for any company) will offer diminishing marginal value, and we continue to believe the future of CGM innovation will be in dramatically cutting cost, reducing calibrations, improving on-body wearability, and offering valuable software that augments the data. Obviously, it needs to give the data people expect too! Getting the right balance of all these factors is the tricky part, and Dexcom and Medtronic are both talking about multiple product lines with different indications (e.g., the fully disposable Medtronic/Qualcomm professional CGM, Dexcom/Verily).
- As we reported at ATTD, the seven-day wear Enlite 3 sensor has an improved algorithm with intelligent diagnostics that determine if it is safe to enter closed loop. The algorithm will also request a calibration when the system detects the overall performance can be improved, and data is not displayed when it detects poor sensor performance.
FIFTH GENERATION CONTINUOUS GLUCOSE MONITORING SENSOR SYSTEM WITH EXTENDED WEAR AND FEWER CALIBRATIONS (905-P)
J Ulloa, A Varsavsky, R Gautham, I Premakumar
Following its ATTD poster hall debut, a Medtronic poster shared a larger data set on its fifth-generation sensor (i.e., Harmony 1), featuring one calibration per day, 10-day wear, and an overall MARD of 11.4% vs. the Bayer Contour Next Link meter (n=142 sensors, 12,602 evaluation points). This accuracy study included 37 participants with diabetes who wore up to four sensors on the abdomen or arm for 10 days. Meal challenges were administered at three in-clinic session (days 1, 7, 10), and blood glucose measurements were recorded every 15 minutes for three to four hours with the Bayer Contour Next Link meter. Participants were also asked to take 8-10 blood glucose measurements daily when at home. Overall MARD was 11.4% (12.3% on the abdomen and 10.5% on the arm), including a day #1 MARD of 13.3%. Mean absolute difference (MAD) in hypoglycemia (<70 mg/dl) was 11 mg/dl, and 85% of overall points were within 20 mg/dl or 20%. Sensors lasted a mean of 9.5 days, though an unspecified number were removed from analysis early due to adhesiveness or battery failures – the percentage was not specified, and both are critical question marks for Medtronic’s clamshell transmitter design (larger on the body and less secure than Dexcom and Abbott sensors). Roughly 45% of sensors had a MARD of 10% or less. The fifth-gen CGM includes a 90-minute warm up, redundancy via two sensor flexes, a proprietary fusion algorithm to combine the two outputs, and intelligent diagnostics to assist with fault detection and sensor health. Overall, this feasibility data looks encouraging, though the accuracy is behind what Dexcom has said it expects for its ten-day wear, one calibration per day G6 (similar to the current MARD of 9.0%). As of Medtronic’s Analyst Meeting last week, a launch of Harmony 1 is expected by April 2019.
REAL-WORLD USE OF OPEN SOURCE ARTIFICIAL PANCREAS SYSTEMS (104-LB)
D Lewis, S Leibrand, and the #OpenAPS Community
This illuminating poster presented self-reported outcomes from 18 out of the first 40 users of OpenAPS, the DIY automated insulin delivery system created by Ben West, Dana Lewis, and Scott Leibrand (now over 150,000 hours of AID use outside any clinical trial setting!). While using OpenAPS, self-reported outcome measures showed median A1c dropped from 7.1% to 6.2%, an impressive 0.9% reduction in a well-controlled and motivated population. Self-reported median percent time-in-range (80-180 mg/dl) increased from 58% to 81% - consistent with presentations of actual data we’ve seen recently from Mark Wilson (Day #1) and Chris Hanneman (D-Data last fall). Fourteen out of 15 respondents reported some improvement in sleep quality, and 56% reported a large improvement. Respondents were “extremely satisfied with the “life changing” improvements associated with using an APS,” even if they “require significant effort to build and maintain” and “cannot be considered a technological cure.” The poster notes that OpenAPS is designed to be, and has been, far safer than standard pump/CGM therapy, as measured by duration of hypoglycemia and hyperglycemia, with no reports of severe hypoglycemia or hyperglycemic events. The OpenAPS design considerations posted here are pretty instructive on the safety front (only temp basals, no automatic correction boluses, etc. – much like the 670G hybrid closed loop!). Our takeaways from this poster and inspiring community are: (i) automated insulin delivery can make a huge difference, even for well-controlled patients; (ii) even though the system is burdensome to set up and wear, patients would not do it and use it unless the benefits were worthwhile; (iii) lots of learning is occurring in the OpenAPS community that could be leveraged for commercial systems; (iv) OpenAPS could push the FDA and industry to move faster, and that is a good thing; and (v) the relative risks here seem low, given the setup burden, the solid design for safety, and real-world dangers of insulin therapy.
- As an aside, and as would be expected, patient – researchers like any other researchers buy badges to present this poster – that is part of the support of the ADA bringing together so many researchers for discussion. However, patient-researchers do not have the support of work environments like manufacturers or universities. This creates a wonderful opportunity for a foundation or other organization to endow funds to create a pathway for patient researchers to not lose savings to present their data. We hope patient research will increasingly be supported by the existing healthcare community, since greater dialogue can be particularly beneficial. We are eager to see more patient learning make its way into professional organizations, such as Dr. Joyce Lee’s commentary from “Digital Health: Hope or Hype?” and we hope that can change. We salute Dana and Scott for submitting this poster and getting it accepted as a late-breaker and we look to the field to come up with creative solutions to support this work.
- OpenAPS now has over 80 users worldwide, though only 40 were using the system at the time of abstract submission, which makes this 18-person evaluation a near 50% response rate. Of course, as with any other research, the self-reported component of the outcomes may be interpreted cautiously.
- The poster has an instructive discussion section, noting that some healthcare providers are supportive of OpenAPS, and others showed a “lack of interest.” However, OpenAPS experiences “are instructive for what patients can expect from commercial APS when they become widely available, and can help HCPs be prepared to set patients’ expectations properly when discussing or recommending APS.” We totally agree and hope to see more dialogue between the traditional healthcare community and the OpenAPS community.
-
The poster’s questions for HCPs to consider are also fascinating:
- Artificial pancreas systems are already here. One of your patients may already be building one. Would you know it if they are? Do you discuss with your patients which tools they choose to use to help manage their diabetes?
- APS are a powerful tool, but not a cure. Patients and HCPs will still need to do a lot of work to use them effectively to improve diabetes management.
- Patients and HCPs must educate themselves and each other on how APS can be used effectively in daily life.
- Though OpenAPS has improved in wearability and form factor, it still requires carrying extra gear, as accessing pump commands remains difficult. The community has posted all the reference design, documentation, code, and community channels at www.openAPS.org, though this system requires a fair amount of effort and motivation to put together – hence why we don’t see it as high risk right now. In the process of building it, users must intimately understand how it works, and it is certainly not plug and play. We know smart people using the system now that spent hundreds of hours setting it up.
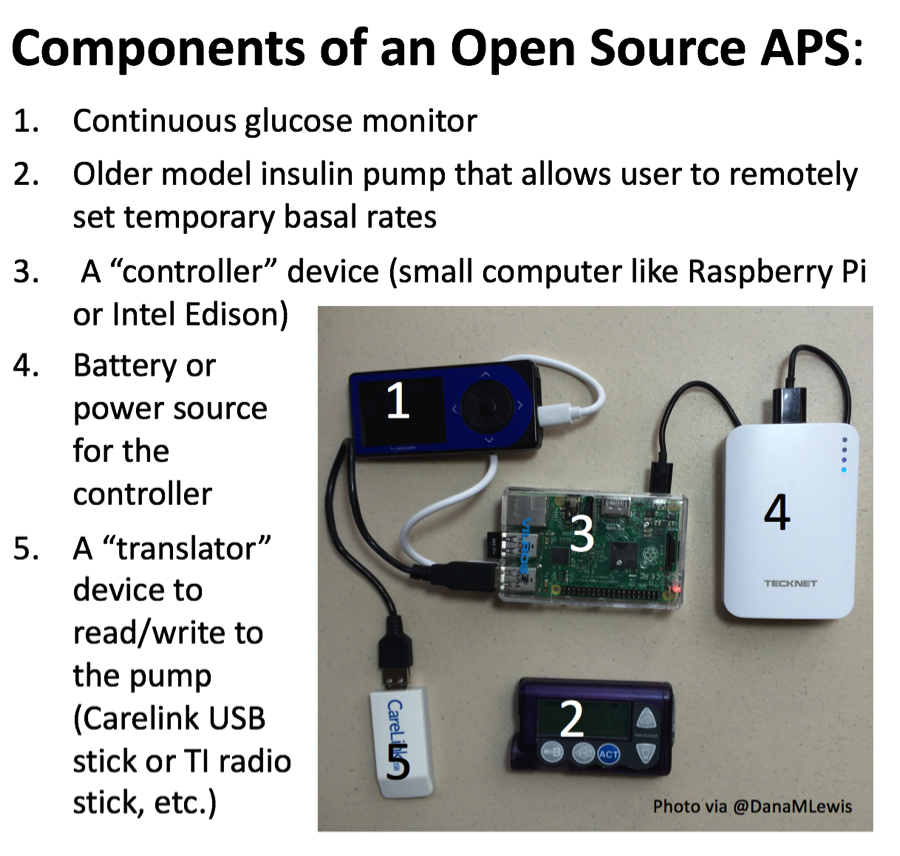
ACCURACY AND LONGEVITY OF AN IMPLANTABLE CONTINUOUS GLUCOSE SENSOR IN THE PRECISE STUDY: A 180-DAY, PROSPECTIVE, MULTICENTER, PIVOTAL TRIAL (892-P)
J. Hans Devries, Jort Kropff, Pratik Choudhary, Sankalpa Neupane, Stephen C. Bain, Christoph Kapitza, Thomas A. Forst, Manuela Link, Andrew D. Dehennis
A Senseonics poster shared full accuracy data from the 180-day EU pivotal study of its Eversense implantable CGM system, showing an encouraging MARD of 11.6% vs. YSI, though only 40% of sensors successfully reported data over the 180-day period. The single-arm, multicenter investigation enrolled 71 patients with type 1 diabetes, who had two sensors inserted bilaterally into their upper arm (Clinical Trials Identifier: NCT02154126). At first glance, six-month accuracy was relatively encouraging and consistent with preliminary 90-day data first seen at DTM 2015 – overall MARD was 11.6% with Clarke Error Grid analysis showing 84% of measurements in Zone A and 15% in Zone B (# of paired points unreported). Pre-specified secondary endpoints showed accuracy diminished in the hypoglycemic range (<70 mg/dl), where overall MARD was 22%. The median sensor life was just shy of five months, and only 40% of sensors successfully reported continuous glucose data out to 180 days. Naturally, the findings beg the question of how much this adds to Eversense’s product profile, and how it will compete with next-gen offerings from Abbott, Dexcom, and Medtronic - of course, we're always glad to see expanded options and form factors, since CGM penetration is far too low. We look forward to seeing how initial commercialization goes this year in Europe, and what Senseonics can get in its label with this updated long-term data (e.g., 150-day wear? 180-day wear?).
- As a reminder, Senseonics does have plans to submit a CE Mark amendment for its second-gen transmitter in 3Q16 that features a number of form factor improvements. We wonder whether the updated design will include improvements in durability.
- Senseonics has long discussed the extension of its sensor life from 90 to 180 days as a priority, though we wonder if these results will support that label. This was previously slated for a 2Q16 CE Mark submission, and we’re not sure if this has happened yet. We assume the 180-day results will not materially impact ongoing launches in Sweden and Norway/Denmark or upcoming launches in Germany, Italy, and the Netherlands. For more details on Senseonics upcoming plans, see our coverage of the 1Q16 update.
PATIENT USER EXPERIENCE EVALUATION OF BOLUS PATCH INSULIN DELIVERY SYSTEM
V Zraick, D Dreon, R Naik, D Shearer, S Crawford, J Bradford, and B Levy
This poster presented solid data demonstrating that patients (n=44; 40 with type 2, four with type 1) were very pleased with J&J’s OneTouch Via (formerly Calibra’s Finesse), a “discreet, wearable, on-demand, mealtime insulin delivery solution.” Over 50% of the cohort completed product training within a half hour – a strong testament to the usability of the bolus-only, three-day wear device. Following the eight-week trial, 86% of users reported being extremely/very satisfied with the system, and 79% were extremely/very likely to request a prescription from their HCP. Similarly, 74% of patients said that they would incorporate the Via into their routine. There was an interesting learning curve that emerged in the data: After week one, patients reported that they dosed with the Via the same number of times that they typically would with their pen/syringe. By the midway and end points of the study, patients had adjusted to the device, and >50% reported injecting prandial and snack-time insulin more frequently than they had with their pens/syringes. Of course, because information about dosing frequency was self-reported, it’s hard to know how dosing actually changed. We will be curious to see the results of the ongoing OneTouch Via outcomes study (n=312), which has a primary completion date set for this December. J&J reported at its Medical Device Business Review last month that it will file OneTouch Via for approval in 2H16, and we’ve learned from the company that it will be commercially available in select markets outside the US by late 4Q16, with US to follow soon thereafter in early 2017 – this is an update from the Medical Device Business review, which called for a launch within the next 12 months (by May 2017).
- HCPs were also big fans of the OneTouch Via! Every single one was satisfied at the end of the eight-week usage period and was likely to recommend. A large majority also viewed the Via favorably when compared with syringes and pens.
- This simple device has the potential to improve regimen adherence. With the Via, the majority of users in this study reported satisfaction with their abilities to (i) discreetly and easily administer a bolus in public without painful injections, (ii) worry less about the possibility of forgetting pens/syringes, and above all, (iii) lead less stressful lives. Thus the Via overcomes many barriers to usage associated with MDI.
JDRF/NIH Closed-Loop Research Meeting
PIVOTAL STUDY DESIGN
Steven Russell, MD, PhD (MGH, Boston, MA)
Dr. Steven Russell summarized a paper he co-authored with Dr. Roy Beck, soon to be published in Diabetes Care. The table below highlights his commentary on pivotal study design for artificial pancreas systems, building off the question we asked last year, “What is the appropriate control group for an artificial pancreas pivotal study?”
| Design Consideration | Recommendation | Alternative | Comment |
| RCT Type | Parallel | Crossover | Crossover Design requires long washout |
| Study Population | Representative of population, patients who use MDI and CSII, with few exclusions. Range of A1c’s. | Adults-only, high-risk patients excluded | Given the potential for off-label use, the FDA may not approve if the device is not demonstrated to be safe in a broad population and payers may limit coverage to only the population that was studied |
| Randomization (artificial pancreas: Control) | 2:1 | 1:1 | 2:1 randomization provides greater exposure to artificial pancreas, 1:1 randomization will require a smaller sample size or give greater power for same sample size if equal variance. |
| Control group | Usual care | SAP | Both scientifically valid, usual care has numerous pragmatic advantages |
| Superiority vs. non-inferiority | Superiority | Non-inferiority | Non-inferiority may be insufficient for approval but is not likely to drive reimbursement and adoption |
| Run-in period | Blinded CGM monitoring | Unblinded CGM (SAP training) | Unblinded run-in must be sufficient to achieve competency for SAP trial enrolling non-SAP users |
| Duration | 6-12 months | 3 months | 3 months min for A1c; longer duration shows continuation of use and durability of effect |
| Primary outcome(s) | A1c, time <60 mg/dl | A1c only | A1c does not capture hypoglycemia; CGM more reliable and quantitative than participant recall |
OUTCOME MEASURES FOR ARTIFICIAL PANCREAS CLINICAL TRIALS: A CONSENSUS REPORT
David Maahs, MD (Barbara Davis Center, Aurora, CO)
Dr. David Maahs also summarized a soon-to-be-published Diabetes Care paper focused on standardizing a short set of basic, easily interpreted outcomes in artificial pancreas studies. The paper has 24 authors, many of whom are considered leading thinkers in the field. The goal is to facilitate interpretation and basic comparison between studies, and more importantly, to accelerate adoption of artificial pancreas technologies via regulators, HCPs, payers, and patients. As an aside, Dr. Maahs has accepted a position to join Stanford pediatric endocrinology team – congratulations to Dr. Bruce Buckingham – again!!
| Key Outcome Metrics | Comment |
|
A1c Mean CGM glucose |
If intervention >3 months) |
|
% time in 70-140 mg/dl % time in 70-180 mg/dl % time <50, <60, <70 mg/dl % time >180, >250, >300 |
All CGM measures should be reported for the overall 24-hour period, and also stratified by daytime and nighttime period. The time midnight to 6am is proposed as a nighttime definition. |
|
Standard Deviation Coefficient of Variation |
|
| Severe hypoglycemia | As defined by ADA (adults) and ISPAD (children/adolescents) |
| DKA events | ADA definition |
| % of time closed loop active | |
|
TDD of insulin TDD of glucagon or other hormones |
|
Other considerations: # of symptomatic hypoglycemia events per week CGM calibration, MARD Study design and stratification into relevant subgroups ITT analysis Report medians (quartiles) instead of mean if not normally distributed |
Exhibit Hall
ASCENSIA
Ascensia has come to ADA 2016 with a bang! The company’s large bold booth at the back of the exhibit hall was decked out in the new purple and blue colorway, and it was refreshing to see a big investment in ADA real estate after the company’s absence at ADA 2015. Reps informed us that the transition to a standalone company has really allowed the teams to flourish, citing the company’s recently launched Contour Next One and Contour Plus One Bluetooth-connected BGM systems (currently launched in Switzerland and Poland respectively; CE Mark in May 2016). Additional EU launches are planned for later in 2016. The Contour Next One system is still being reviewed by FDA and the company anticipate clearance before the end of 2016.
BD
Reps in BD’s booth shared new news that the MiniMed Pro FlowSmart Infusion Set with exclusive partner Medtronic will launch in the US and France “by the end of 2016.” This is the most concrete forecast we can recall hearing to date and confirms previously disclosed plans to orchestrate a “limited launch” in 2016. It’s great to hear that patients in the US will have access during this soft launch period (we’re hoping we’ll have the chance to try it out!) but assume that this will be fairly low-key at first. The purpose of the soft launch is to gather feedback from early users to inform the subsequent full-scale rollout. Back to the booth, the infusion set itself was not on display as BD – per usual – focused its exhibit on injection counseling technique. We were sad to see that BD has retired its classic lipohypertrophy demo (“Lipo Larry”) but very excited to see what he was replace with – two virtual reality simulations! The demo allowed us to experience an injection technique counseling session as a patient with type 2 diabetes who had just been instructed to go on insulin, with one video documenting common mistakes physicians make and the other documenting best practices. Kudos to BD for bringing this experience to attendees! We’ve heard the demo has been wildly successful, sharing that multiple providers have asked to have access to the videos in their clinic (to show peers) while one promised to changed the way he addressed patients after watching the video – we’d very much hope to hear more of that.
- Consistent with the injection technique theme, BD’s booth also shared data that showed improved clinical outcomes at three months for type 1 and type 2 insulin-treated patients who optimized their injection technique. Patients (n=346) in this uncontrolled study received intensive education on the value of rotating injection sites and instructions to switch to BD’s Ultra-Fine Nano 4 mm x 32 gauge pen needles. Results looked encouraging – patients in the intervention cohort saw: (i) a 0.6% reduction in A1c (baseline not provided; p<0.05); (ii) a 14.2 mg/dl reduction in fasting glucose (baseline not provided; p<0.05); (iii) a two units reduction in total daily dose (baseline not provided; p<0.05); and (iv) a 0.5 kg/m2 BMI reduction (baseline not provided; NS).
- BD has unveiled new branding. The company has: (i) embraced a “lighter, brighter” look following the acquisition of CareFusion; (ii) updated its logo – see the new look below; and (iii) has updated its slogan from “Helping people live healthy lives” to “Advancing the world of health.”